Two brochure endpoints and a visual guide do not constitute a continuously measured pressure curve. Confirm the data and test conditions before comparing AGM separators.
01
Identify the plotted data
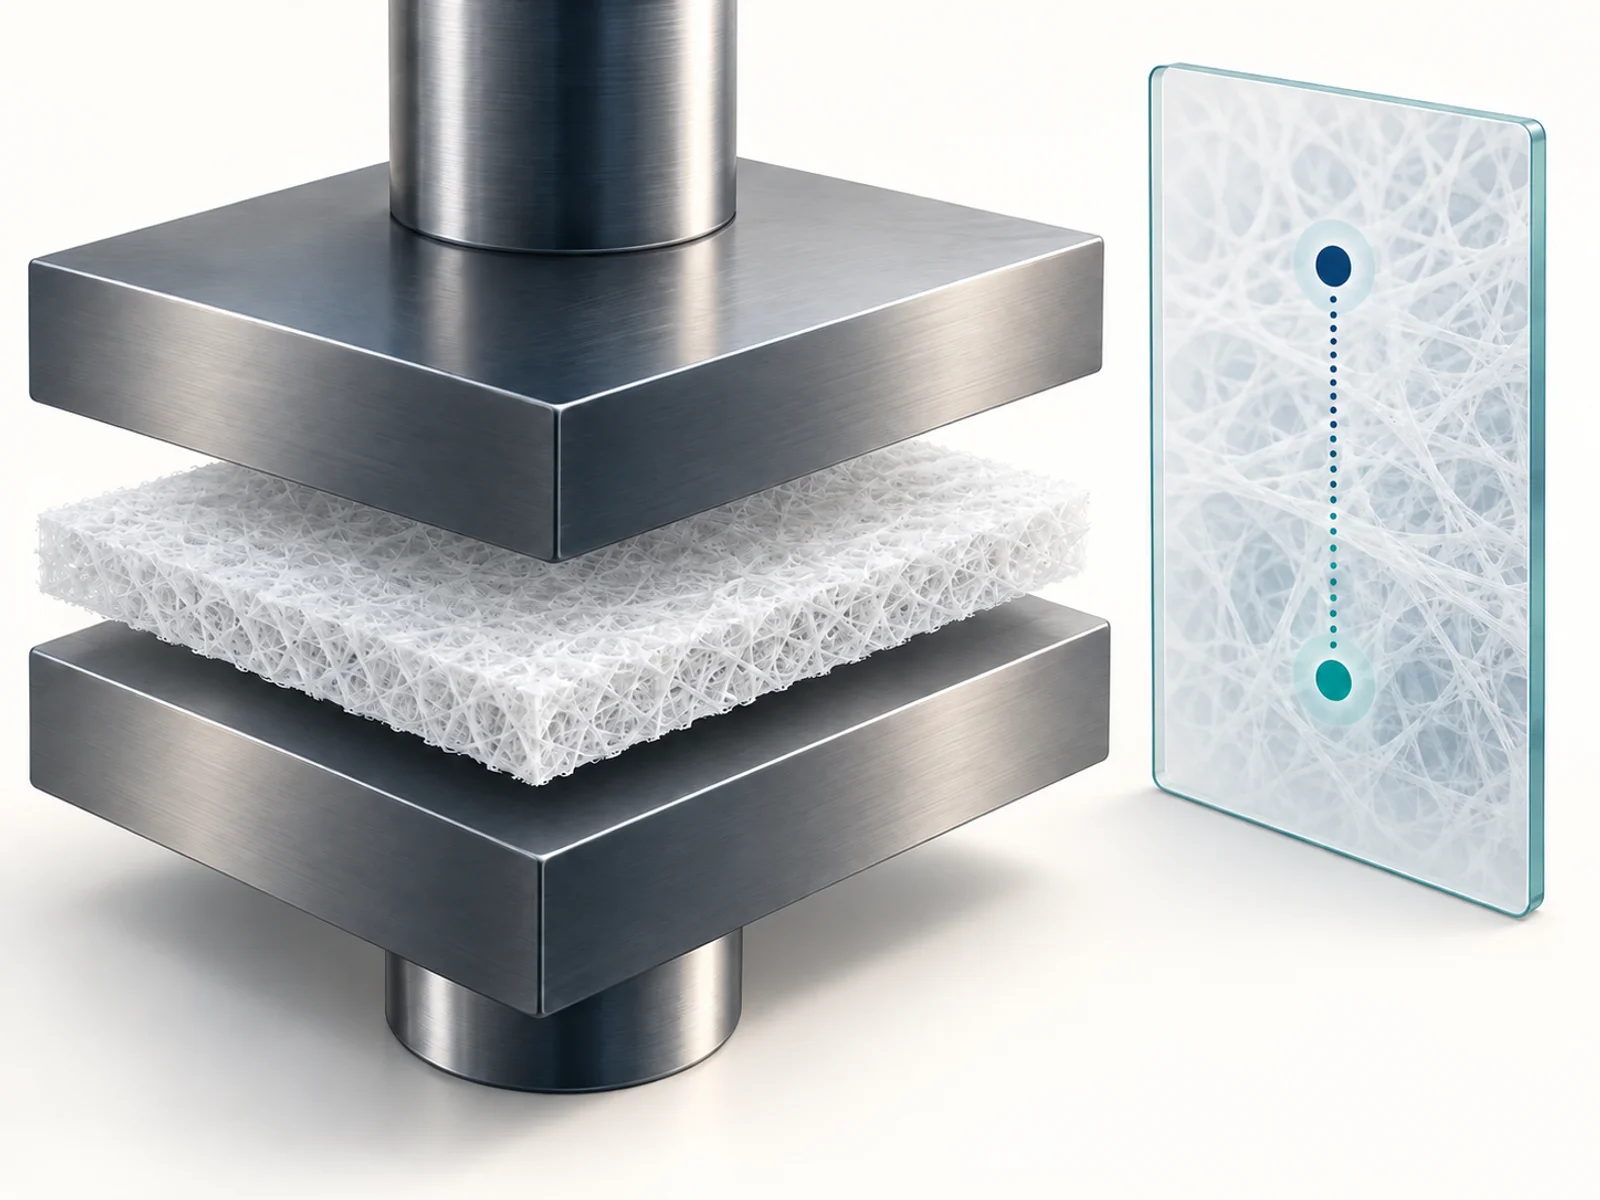
The AlphaBeta automotive start-stop AGM separator product page presents brochure nominal values alongside design values. Its compression and recovery chart displays approximate values read from the printed brochure at 10 kPa and 100 kPa.
02
Read the connecting line correctly
The straight line between the two displayed points is a visual guide. It does not represent measurements at intermediate pressures. Review endpoint charts separately from continuous measurement records.
03
Do not interpolate performance
The two endpoints alone cannot establish thickness or recovery at intermediate pressures, reconstruct complete loading and unloading curves, or predict full-battery service life through two-point interpolation.
04
Keep endpoints separate from assembly requirements
The 10 kPa and 100 kPa values are endpoints on this specific product page, not universal assembly-pressure standards. No intermediate measurement points are listed; this does not establish whether the company has performed other internal tests.
05
Agree the comparison conditions
First specify the target assembly pressure. Then confirm sample condition, loading or unloading process, measurement-point arrangement and repeat-measurement conditions. This is guidance for technical communication, not a uniform industry test standard; agree conditions for the sample and project.
06
Keep the source in context
The parameters and chart description come from a corporate product page and information attributed there to its printed brochure. They are not an independent test report or a new-product announcement published this week. They are not Viking specifications or guaranteed performance.