A first sample can pass inspection and assemble smoothly, while the next batch still requires repeated line adjustment. The issue is not always an out-of-spec result. A single inspection describes a point; volume production exposes variation across time, rolls and sampling positions.
For buyers and quality teams, the useful question is therefore not only whether the reported average passes. It is whether the agreed method can show repeatable performance from roll head to tail and from sample approval through pilot and volume supply.
Illustrative Data
The same average can hide very different dispersion
Measurements
- Sample set A
- 1.50 / 1.50 / 1.50 mm
- Sample set B
- 1.44 / 1.50 / 1.56 mm
Average
- Sample set A
- 1.50 mm
- Sample set B
- 1.50 mm
Range
- Sample set A
- 0.00 mm
- Sample set B
- 0.12 mm
Interpretation
- Sample set A
- All three points coincide in this illustration.
- Sample set B
- The same average masks wider point-to-point variation.
Process Data
Downstream manufacturing is already managing consistency with process data
The cited company's July 2026 manufacturing update describes automated plate lines, robot cast welding, MES and a digital-twin quality platform covering incoming material, processing, finished-product inspection and outgoing verification. This is a downstream battery-company example, not evidence of Viking's production system. The sourcing signal is still relevant: as battery plants manage more of the process digitally, a supplier average and one certificate are no longer enough to explain repeatability.
Single Inspection
A passing report only answers whether the sampled points crossed the line
A certificate does not by itself show where the sample came from, whether roll head, middle and tail are similar, or whether another roll and production batch will reproduce the result. Sampling too few fixed positions can miss local movement that later appears during continuous unwinding and assembly. The illustrative thickness values above are not Viking specifications; they simply show why equal averages can carry different process risk.
Assembly Impact
Separator variation continues into the plate-group assembly process
Thickness variation changes actual compression within a fixed group gap. Basis-weight and structure variation may correspond to changes in fiber distribution, absorption, porosity and compression behavior. Width, sheet dimensions, roll edges and winding affect line feeding, adjustment and material loss. None of these variables alone determines battery performance, but more stable incoming material removes variables from assembly and failure analysis.
Statistical Review
Volume readiness requires more than an average
Average locates the center; maximum, minimum and range show the observed spread; standard deviation and coefficient of variation help compare dispersion; and a time-ordered trend can reveal drift before the pass rate changes. Cp and Cpk are useful only when specification limits are defined, the measurement system is reliable and the process is statistically stable. They cannot be responsibly inferred from a few samples or used instead of battery assembly and performance validation.
Sampling Plan
Dispersion is only meaningful when sampling locations are documented
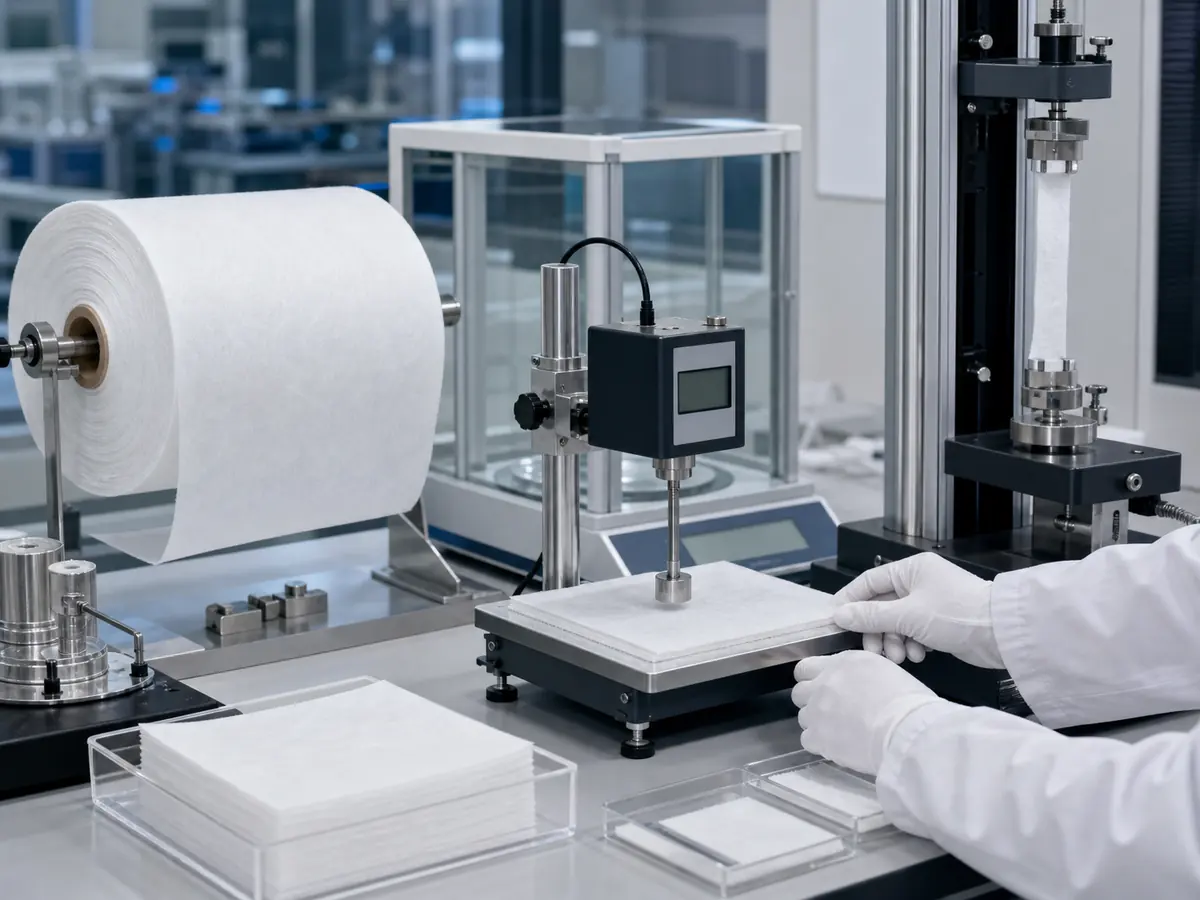
For rolls, a risk-based plan can compare head, middle and tail and, where relevant, positions across the web. Cross-batch work should cover multiple production batches and rolls rather than repeated readings from one roll. Sheet sampling should identify source rolls and slit positions and check whether stacking and packing affect dimensions. Sample, pilot and stable-production frequencies may differ, but every change needs a documented basis.
Traceability Review
A useful audit asks where an abnormal result came from
Supplier review can ask how shipment batches, roll or sheet identifiers, production batches, test records and packing records are linked; which properties are checked by roll or batch; and how abnormal data are isolated and reviewed. This is an audit framework, not a claim that Viking currently operates MES or a fully digital traceability platform. Coding, record-retention and sample-retention requirements should be confirmed for the specific project.
Viking Coordination
Align the volume-evaluation method during the sample stage
Viking manufactures AGM glass-fiber separator rolls and sheets for VRLA applications and can discuss thickness, width, sheet size and packing. For a project moving toward volume production, share the current specification, priority test items and supplier-audit checklist. We can first align the test method, sampling locations, inspection frequency, acceptance range and required batch identification; suitability remains subject to the customer's material, assembly and complete-battery validation.
Average
Shows where the data center sits, but can conceal movement at the upper and lower ends.
Range
Quickly shows the observed span; interpret it with sample size, position and possible outliers.
Standard deviation & CV
Describe dispersion and support comparison, provided the method and conditions remain the same.
Trend, Cp & Cpk
Use trends to detect drift; use capability indices only after measurement and process stability are established.